
Introduction
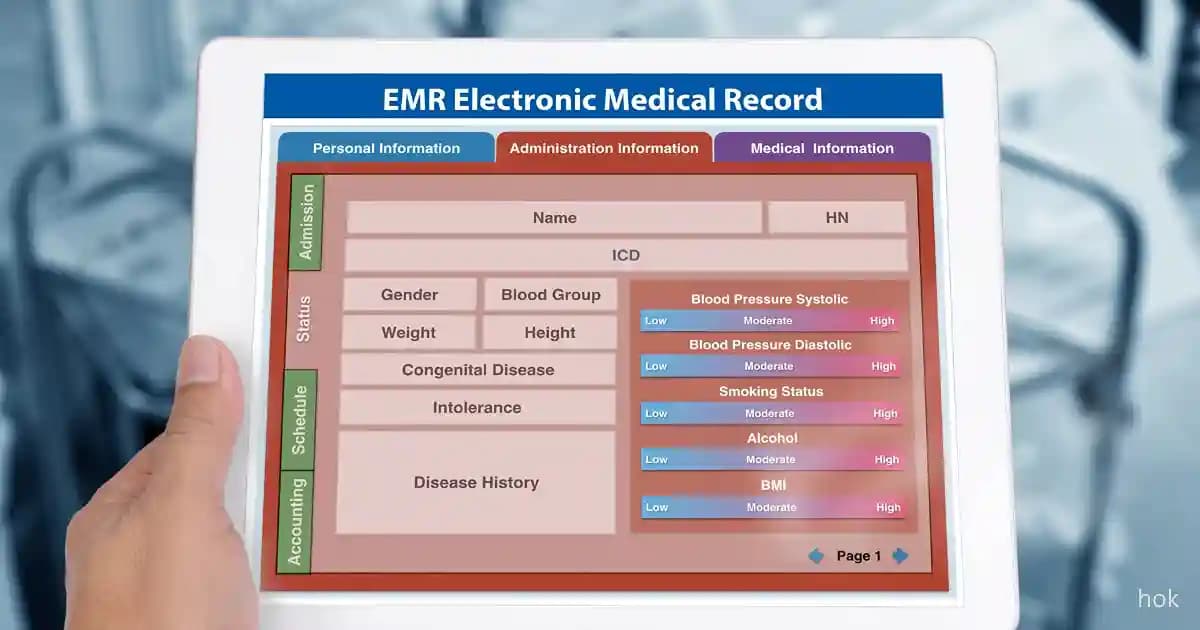
Small hospitals across India are under pressure to deliver quality outcomes despite resource constraints. EMRs today aren’t just digital records—they’re decision-making tools. EMR analytics help uncover trends in diagnosis, treatment, and outcomes—empowering data-driven medicine.
Why EMR Analytics Is a Game Changer
Modern EMRs support clinical decision-making when analytics are actively used — not just when records are captured. Hospitals that build a data-review discipline around EMR outputs see measurable gains in treatment quality over time. EMR tools enable:
- Faster clinical decision-making with historical context available at the point of care
- Early alerts for potential complications or medication interactions
- Reduced test duplication when prior results are visible across departments
- More personalised care protocols informed by demographic response patterns
Key EMR Metrics That Drive Better Outcomes
- Diagnosis-to-Treatment Time: Tracks delay between diagnosis and care initiation. Why: Reduces treatment delays. Metric: Avg. hours between diagnosis and prescription issuance.
- Treatment Plan Compliance: Measures completion of prescribed steps. Metric: Completed steps ÷ Total steps × 100.
- Patient Response Trends: Tracks recovery timelines across patient types. Why: Reveals demographic response patterns.
- Adverse Event Triggers: Detects medication-related issues. Metric: % of alerts for flagged interactions caught via EMR logic.
- Readmission Rate Insights: Correlates discharge data with return visits. Metric: Related readmissions ÷ Total discharges × 100.
Best Practices for Using EMR Analytics
- Train staff to interpret dashboards — analytics without interpretation is just data
- Set alerts for critical threshold breaches (spike in adverse events, drop in follow-up compliance)
- Review KPIs monthly with clinical and admin leadership together
- Combine patient-reported feedback with quantitative data for a fuller picture
- Coordinate between departments for cross-cutting trend analysis
Conclusion
Small hospitals actually have an advantage over large ones on analytics: less organisational friction to change protocols, tighter loops between diagnosis and outcome measurement, and a leadership team small enough to sit in one room and review the data together. The big-hospital analytics stack often produces impressive reports that no one acts on. The small-hospital opportunity is to skip the report-generation ceremony and go straight to protocol-adjustment discipline.
About Zocvi
Zocvi connects patients with verified doctors and evidence-based health guidance. Visit zocvi.com or reach us on WhatsApp at +91-92724-57637.











Comments (0)